DATA VISUALIZATION
Math + Storytelling + Design = Insights
Language puts words together into stories. Math makes sense of numbers. Data visualization pairs the two sides.
We achieve simplicity in visualizing data by three fundamental principles:
Get your data visualization questions answered
Unleash the Power of Visual Analytics
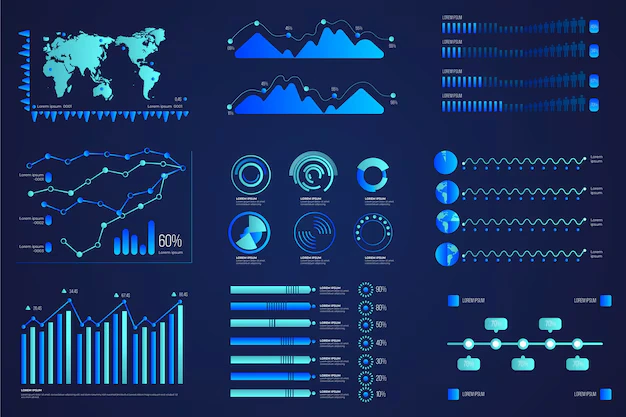
Since the primary goal of data visualization is to communicate complex data clearly and intuitively to a targeted audience via a combination of statistical graphs, charts, tables, information graphics, narratives, etc.
We at Prescience, a Movate Company the top AI, data science and advanced analytics company, combine the skills from web development, data analysis, mathematics, and graphic design to make complex information engaging, beautiful, and interactive.
Here’s a glimpse into a data warehouse and business intelligence solution we created for a manufacturing company, enabling near real-time visibility into the behavior of diverse customer segments.
Interactive Dashboards
Automated Reports
Resources
Frequently Asked Questions
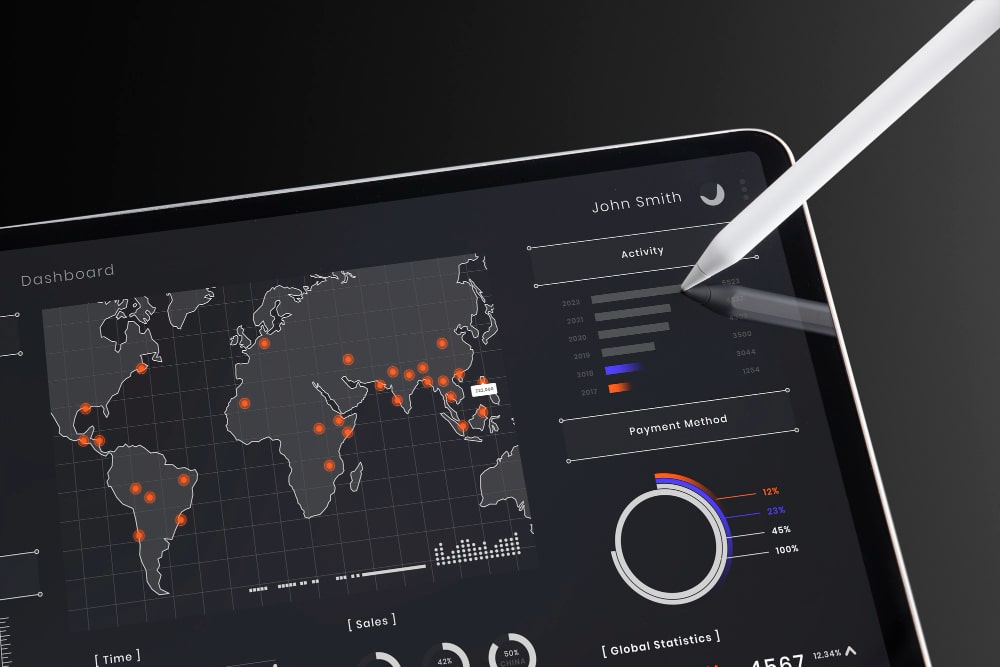
Data visualization involves the use of charts, graphs, and maps to make complex data understandable at a quick glance. By using dashboards and automated reports, you can easily identify patterns in data, thereby allowing quicker and more informed decisions.
Absolutely. Data visualization is relevant to almost every industry that rely on data like retail, finance, healthcare, recruitment, travel, software. It can help you understand trends and patterns clearly as the data is presented in as charts, maps, and graphics to simplify decision making.
There are several BI tools available in the market based on the different business requirements like Tableau, Power BI, Qlik Sense, SAP BusinessObjects, Looker, Oracle BI. We choose the right tools for our clients based on different factors like ease-to-integrate to their regular processes, future needs as the data grows in volume and complexity, security, cost, etc.


