
Predictive analysis in the context of equity markets involves using data analysis, machine learning, and statistical models to forecast future stock prices or market trends based on historical data patterns. For financial advisory firms, one of the key objectives is to predict how a stock or financial instrument will perform on an exchange. This process involves analysing measurable data from the stock market such as historical stock prices, returns, and trading volumes to make quantitative predictions about future stock values. Machine learning is used to develop complex models that can anticipate short, medium, and long-term price trends.
Financial services advisory firms have increasingly been leveraging machine learning and artificial intelligence to provide cutting edge analysis and recommendations to their clients. In 2020, J P Morgan Chase launched a Machine Learning Centre of Excellence (ML CoE) in London. In April 2023, HSBC launched the HSBC AI Global Tactical Index (HSBC AIGT), which used machine learning for equity investing. Morgan Stanley uses Machine Learning to support its financial advisors across investment recommendations, operational alerts and content related to major life events for clients.
- What are the key challenges
- Technology Stack
- Lakehouse Architecture in Databricks
- Solution Overview
- Summary
1. What are the key challenges
Different technologies can be used to build an enterprise platform for financial advisory firms to harness large quantities of stock market data, predict trends, identify lucrative investment opportunities, maximize profits, and mitigate risks to gain a competitive edge. This overall solution will require,
- Different data pipelines to ingest, clean, and aggregate both live streaming data and historical data.
- A machine learning model to predict stock prices.
Identifying the right set of technologies to develop this end-to-end solution is often a major challenge for these financial advisory firms.
2. Technology Stack
Databricks, PySpark and Python can handle live streaming data, historical data, market indicators, and build machine learning algorithms to create this comprehensive solution for financial investment advisors. Prescience Decision Solutions, a Movate company has built a Proof of Concept (PoC) on this stack with a Machine Learning model that can accurately predict stock prices (with 2 days of forecast) with an accuracy level of 90%.
3. Lakehouse Architecture in Databricks
The medallion architecture is a data design pattern used in Databricks based on which an ingestion pipeline is split into the following three layers,
- Bronze Layer
- Silver Layer and
- Gold Layer
The Bronze Layer contains unprocessed, unstructured, and semi-structured data which is a 1-1 copy of the original source data and metadata. This raw data is not suitable for direct analysis or business use cases. The data in the Bronze Layer is typically directly extracted from source system formats such as RDBMS, JSON files, parquet files, CSV files, IoT data, images, audio, and video files, among others.
The Silver Layer comprises of data which is extracted from the Bronze Layer and then processed, cleaned, and transformed. This is an intermediate layer where the data is clean but not aggregated to the extent that it is suitable for detailed analysis.
The Gold Layer contains data which is taken from the Silver Layer and then advanced transformations are performed to further aggregate it into datasets that are ready for consumption.
4. Solution Overview
The overall solution consists of 2 data sources, separate data pipelines built on Databricks and PySpark, and a Machine Learning model built on Python.
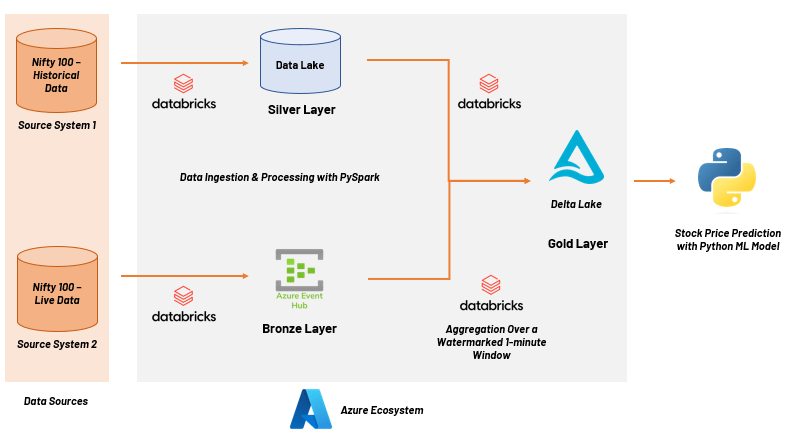
One source system contained historical data of the Indian stocks for a period of 7 years. The second source system provided live streaming data of stock prices from the Indian stock market. For data ingestion, one pipeline was used for batch data and another pipeline for streaming data. The aggregated output of these pipelines was stored in the Gold Layer, based on which the Machine Learning model was built.
i. Data Sources
For the batch ingestion of historical data, we used a source file which contained stock prices of the Nifty 100 stocks spanning from 2015 through 2022. The stock prices were captured at intervals of 1 minute. The daily closing price for each stock of the Nifty 100 was selected as the final value for training the machine learning model. For streaming ingestion of live data, we used financial and business portals for scraping stock prices. These stock prices were captured at an interval of 5 seconds and averaged out over intervals of 1 minute.
While the source system for the historical data contains structured data, the source system for streaming data provides unstructured data in binary format.
ii. Data Pipelines
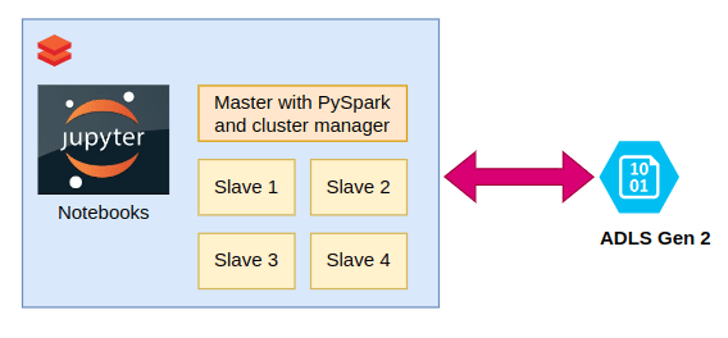
A PySpark cluster was set up with a single master and multiple slaves. Azure Data Lake Storage (ADLS) Gen2 was chosen for the blob where the Data Lake and Lakehouse resided.
The transformations carried out on both the batch data and streaming data included column filtering, decimal truncation, conversion of unstructured data in Event Hub to structured data and windowing and aggregation.
In the first data pipeline, the source file for batch data contained correct records which were already structured, and hence, no Bronze Layer was required. This batch data was directly loaded into the Data Lake, which is the Silver Layer in the solution architecture. This data was then transformed, aggregated, and loaded into the Lakehouse as Delta tables, which is the Gold Layer.
In the second data pipeline, the unstructured source data was in the binary format which encapsulates a JSON semi-structured row of data. This streaming data was stored in the Azure Event Hub which was the Bronze Layer. Moderate transformations were required to make it ready for consumption by the Machine Learning model. The solution stored this data in an intermediate layer such as a DataFrame in a 1-minute window, before appending it to the existing Delta tables in the Gold Layer.
iii. Machine Learning Model
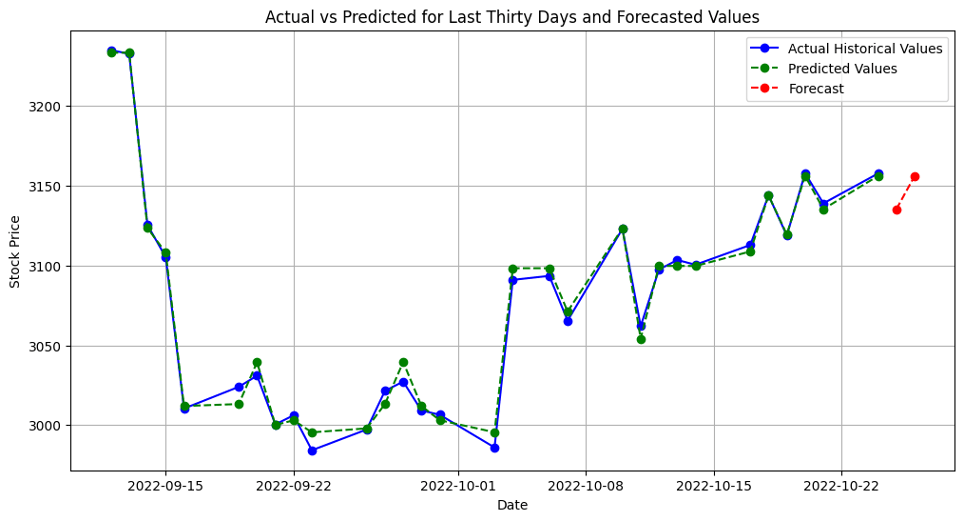
After exploring different models for the best-fit, the gradient boosting model was chosen for correctly predicting the future stock prices. The gradient boosting model required 6 columns including date, high value, low value, open value, close value, and volume. Overall, the PoC solution was able to predict stock prices (with 2 days of forecast) with an accuracy level of 90%.
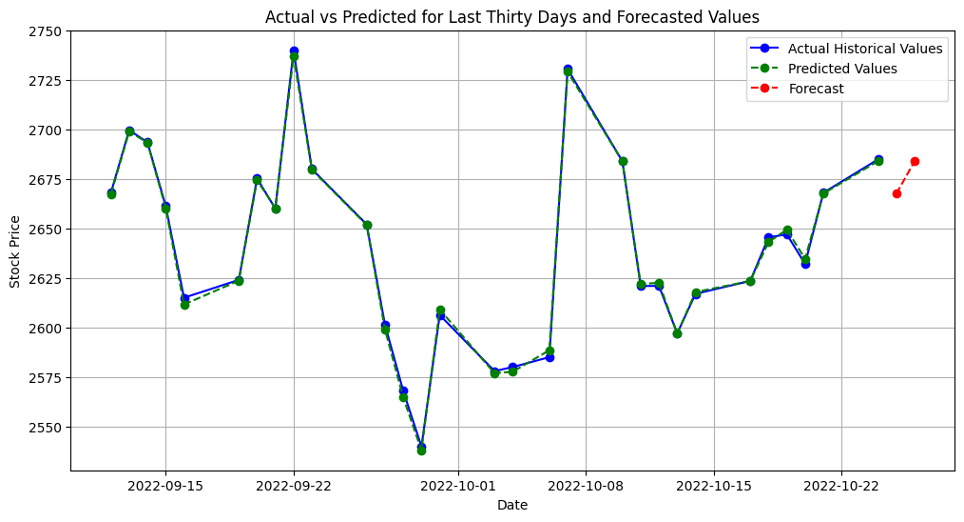
For Company 1, the forecasted values for the next two days were 2667.590496 and 2684.03910813. The R-squared (R2) for last ten days was 0.9985672337868915. The Mean Absolute Percentage Error (MAPE) for last thirty days was 0.05327257370089775.
5. Summary
The Prescience, a Movate company solution harnessed the inbuilt streaming capability of PySpark to simplify the windowing job which otherwise would require much more complex code. Databricks being scalable at both the compute and storage level, provided a platform to scale up or scale down the cluster depending on the workload. Hence, this solution can handle any data volume for both historical data loads as well as live streaming data. The Azure Event Hub simplified the implementation of storing streaming data and avoided the usage of Kafka, which would have been more difficult to manage with streaming data.
If you are looking for a starting point for your business, take advantage of our personalized FREE consultation workshop Sign up here.
Subscribe for regular updates on AI and Data Innovations, case studies, and blogs. Join our mailing list.

Diptopal is a B.E. graduate in Electronics & Communication Engineering. He is interested in automation frameworks, data pipeline design, electronic circuits, and the Linux kernel. Dipto is also an avid sci-fi fan.