
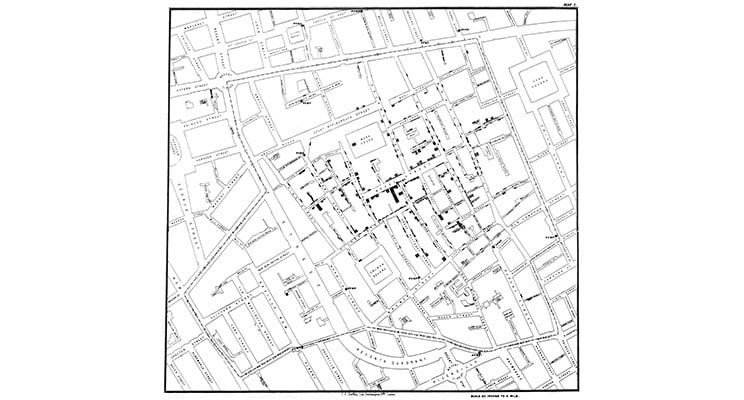
The very first case of COVID-19 was reported by healthcare officials in Wuhan City, China in December 2019. Since then, this disease has claimed hundreds of thousands of lives. From the beginning when we were not sure about how the transmission takes place, to setting up of protocols and associated precautions that need to be taken for our safety, our understanding of this disease has expanded exponentially. In order to understand how we got here, we have to look back to how we have been able to leverage knowledge for the good of the society. A pandemic does not happen often, but when it does, it upends lives as we know it. We are fortunate to live in a world where we have the tools to rapidly disseminate the information and make decisions based on data. The earliest example of using data analytics to help defeat diseases would be the mid 19th century work done by Dr. John Snow (it’s okay if GoT popped into your mind) to help lay what has now become the foundation for epidemiological studies. His pioneering work on using data visualization to plot cholera clusters helped eventually get a handle on how cholera was getting transmitted. Keep in mind that this was a time when our understanding of modern medicine was rudimentary at best with the assumption that cholera spread through “bad air”.
Since the time of Dr. John Snow, our understanding of biology and technology has improved significantly. While we took longer to understand COVID-19 than we would have hoped for, we have been able to deploy the resources we had, to maximize our effectiveness and efficiency in combating the disease and in finding a vaccine against it.
The disease has had a diverse impact across countries and even across provinces within the same country. What has been common across all countries is the substantial amount of data that was being generated every minute and this data helped and continues to help save a number of lives saved due to open dialogue and sharing of data amongst researchers.
At Prescience Decision Solutions, a Movate company, we have drawn a parallel in addressing COVID-19 related challenges with regards to the work we have been doing in the supply chain sector. We leveraged our understating of machine learning and artificial intelligence to help free up resources for multiple large organizations, helping their staff to utilize their expertise on more complex problems.
Issues faced by one of the largest cities in the country with an increasing number of cases
The primary issue with containing COVID-19 has the exponential rate at which it started to spread. Take for example the case of one of the states most heavily affected by the disease. On March 11, 2020, the World Health Organization declared COVID-19 a pandemic. At that point this entire state in India had 26 cases reported daily. Two months later, this number had risen to 1700 to 2000 cases per day. By June it was 19,000 per day, August saw 57,000 cases per day and close to a 1,00,000 cases per day by September 2020. This essentially created a whack-a-mole problem. The cases were rising so quickly that the system was getting overwhelmed. The officials were focusing on the immediate job of saving lives, and this left too little resources available to plan and act based on the learnings.
With an ever-rising number of cases, the city corporation was looking for deriving insights that would help in a more effective management of the disease and the infrastructure required to do so. The three critical insights derived from our engagement with the city corporation were:
- Effective management of hospital resources
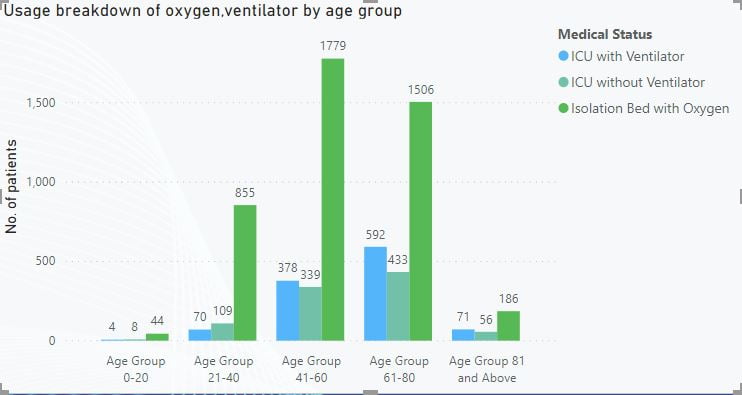
The resources across states reached a critical breaking point very quickly due to the rapid rise in cases. The hospitals quickly pivoted to taking the help of analytics to ensure that proper resources are deployed at the right time by simulating the projected infection rate. The following image is an example of one such usage to understand the demand for ventilators and oxygen so that hospitals could be well prepared.
- Identification of patient criticality at the time of hospitalization
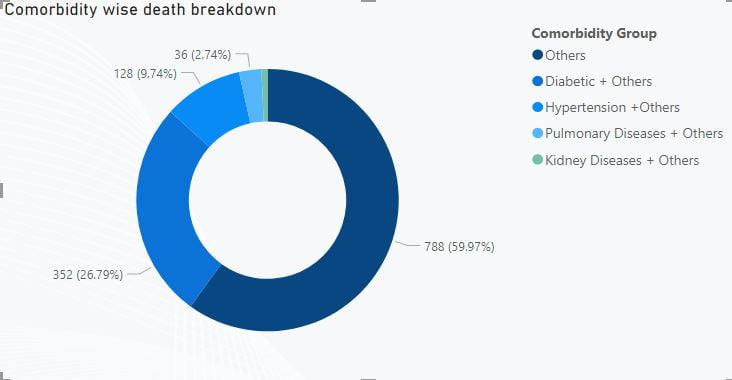
Every patient getting admitted to the hospital was coming in with different underlying conditions. Through the help of proper data analytics, the healthcare workers were in a better position to triage incoming cases. By allowing the data to help in decision-making the doctors were able to work with a higher degree of efficiency, in turn, helping save more lives. The example shown below is an illustration of how doctors were able to visualize the counts by comorbidity and then based on this data advise people with underlying conditions to take necessary precautions with urgency.
- Identification of the most effective line of treatment
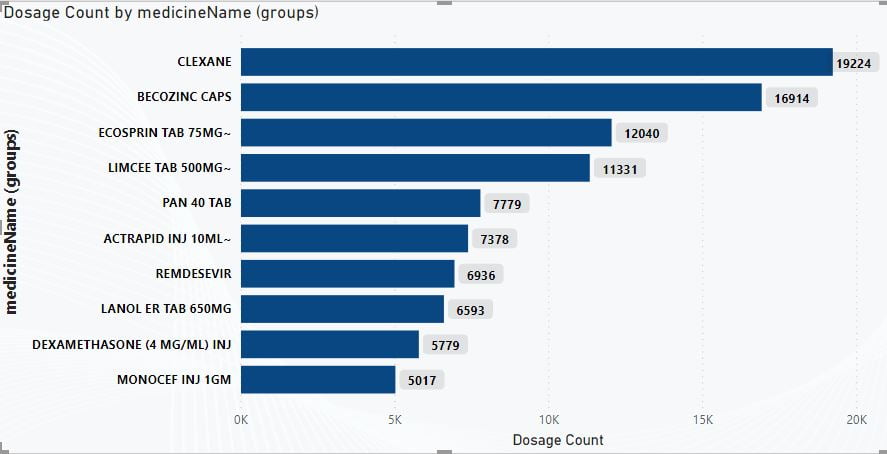
The constant loop of learning can possibly create situations where everything is not available for the healthcare worker to recall all the time. This, coupled with physical exhaustion had created possible life-threatening situations. By allowing the insights from analytics to provide all possible avenues of treatment, the possibility of a missed treatment path was avoided. It was possible to constantly update this information based on new research from across the world, resulting in more saved lives. An example was tracking the prescription of different drugs to understand the ones being prescribed more often than not to find patterns.
Additionally, data from live cases helped researchers to arrive at an overall strategy for dealing with the disease. By integrating live data, we helped provide a constantly evolving model that was dynamic and agile. This analytics included:
- Demographic and co-morbidity profiling in real time. This allowed healthcare workers to reference real-time data to ensure that most up to date care is being provided.
- Socio-economic factors are especially important to be taken into account. With a lot of research being done into COVID-19 across the world, it is particularly important to take into account the actual conditions that the patient has to contend with at home.
- Diseases pattern over a period of time. With multiple strains of the same disease spreading across the world. It is of utmost importance to leverage the data of how and where the cases are reported to help create response plans.
Our essential healthcare workers need to be applauded for their efforts. Not only have they been putting in countless hours working to save lives, they have also been researching and analyzing just as hard. It was not enough to approach this new disease with the knowledge they possessed in December 2019. There was a need to constantly stay in step with new research and findings coming up almost every day.
In our battle against COVID-19, our modern understanding of data science to evaluate constantly emerging information, filter out biases, aggregate information and identifying key insights have all played a significant role. COVID-19 has helped accelerate the usage of data analytics in healthcare. This is a sector that has previously been very cautious in its use of technology as lives depended on the reliability of a solution. Some have compared this to field medicine with the focus transfixed on the saving as many lives as possible. We are glad that we were able to contribute even a small part towards such a noble endeavor of saving lives.
If you are looking for a starting point for your business, take advantage of our personalized FREE consultation workshop Sign up here.
Subscribe for regular updates on AI and Data Innovations, case studies, and blogs. Join our mailing list.

Shivakumar is a keen follower of scientific trends and an Asimov fan. He believes solid execution is the key to the success of any strategy and is focused on building a world-class data science team at Prescience. He has a B.Tech from IIT Delhi and an MBA from IIM Lucknow, with 20+ years of experience in the technology space.