April 10, 2025

The company is involved in ride hailing services, food delivery services, courier services, and freight transportation services in around 70 countries.
THE CHALLENGE
The total number of active platform consumers in a month, across ride hailing and food delivery services, is 161 million. Given this high volume of consumers, the company had designed several solutions to proactively identify and mitigate different types of operational and financial risks from both their riders and drivers, without negatively impacting the end user experience. One of the risk management solutions included a prebuilt suite of business rules that flagged consumers as potential risks based on different patterns of user behaviour. In such cases, the system either blocked these accounts or their existing payment methods to avoid further issues.
To ensure that this solution did not inadvertently prevent genuine consumers from using their platform, the company designed a new series of user activities or challenges, that would allow consumers who were flagged to verify their profile and payment options. Then, they could continue to use the ride hailing platform. The business users did not have a proper mechanism to track the progress of this new user validation program or understand why different key performance indicators (KPIs) were changing month on month.
The company needed an analytics partner to help automate a solution that split the users into different segments, provide dashboards on various KPIs and identify anomalies in various months.
THE SOLUTION
The Prescience, a Movate company team studied the existing user validation program to understand how the current solution was being monitored by the company’s business users. One of the principal metrics for tracking this validation program was the success rate, which showed how many consumers who were asked to verify their profiles had successfully done so. Based on this success rate, the different consumers that were flagged by the program were then split into two cohorts, with ‘Good Users’ having a targeted success rate of 100% and ‘Bad Users’ having a targeted success rate of 0%. Other KPIs included the overall count of impressions, number of users who qualified for the validation activities, attempt rate etc.
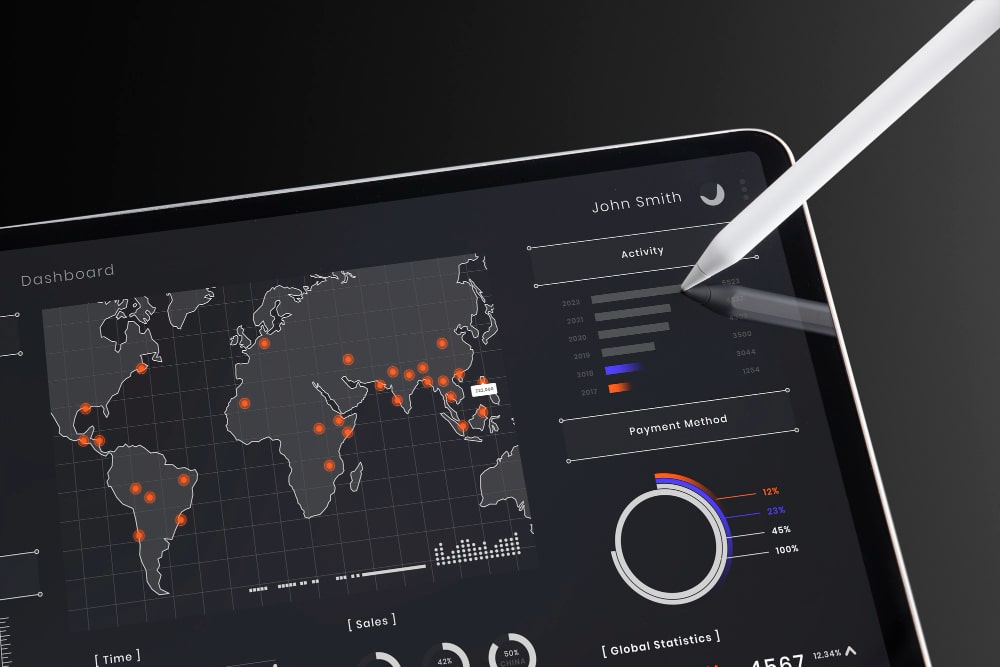
To streamline the data analysis, our team automated the delivery of a set of monthly dashboards and reports that provided business users with detailed insights into the new user validation program. On an on-going basis, the team is also responsible for providing monthly root cause analysis (RCA) for various fluctuations in user behaviour, trend analysis for the KPIs and deep diving into certain metrics, such as spikes in the attempt rate, lower conversions than expected etc.
The different technologies used for this engagement included,
- Microsoft SQL
- Python
- Google Sheets
- Google Looker Studio
THE IMPACT
With the automation of the solution to track the user validation for the risk management solution, the business users were able to analyse the effectiveness of the new program. They found that good users who passed the verification process continued to book new rides which directly improved the overall user experience levels and increased revenue for ride hailing services.


