February 4, 2025
The company is a global group of petrochemical and energy companies with operations in over 70 countries. It has over 47,000 retail service stations and serves over 1 million commercial customers, along with 33 million retail customers, on a daily basis.
THE CHALLENGE
The company had an existing Loyalty program through which their customers accumulated loyalty points each time they purchased fuel or different items from the retail stores located in their fuel stations. Additionally, customers in the United Kingdom who had bought 6 coffees from their retail stores were eligible to get their 7th coffee for free.
While there were many customers that availed of this continuous offer, the company only had limited insights into the effectiveness of the loyalty program. They did not have detailed views into overall customer preferences for coffee products, the top store locations where redemptions were taking place, the financial viability of the entire offer, what products their customers were purchasing during redemption etc.
Overall, the company was looking for further insights with various key performance indicators (KPIs) that would help them analyse the success of this on-going program while providing detailed insights to their marketing and product teams. These findings would also be required for the company to design new redemption programs with other partners whose products were available in their retail stores located in fuel stations.
THE SOLUTION
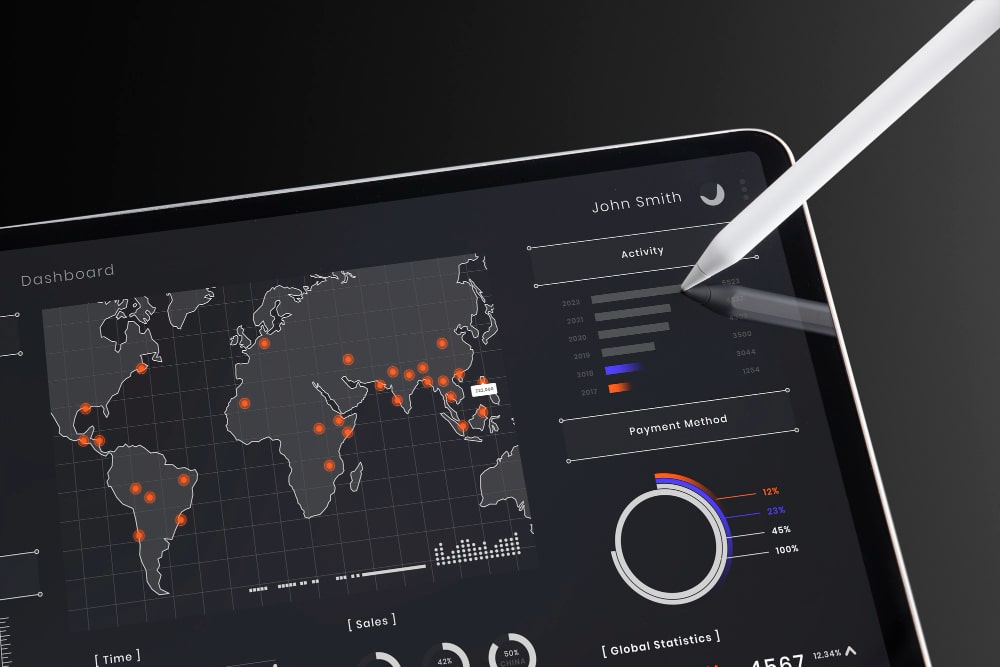
The Analytics team from Prescience, a Movate company studied the existing loyalty program and the metrics were being tracked. They designed and developed 3 new dashboards to automate the insights and provide users with a comprehensive view at the overall program, detailed site and product level.
The first program dashboard involved high level KPIs including the total unique customers that had availed of the offer, the cumulative cost of the coffees that were redeemed, the total value of the coffees purchased prior to redemption, the top sites at which offers were redeemed by count and value, as well as the top coffee products redeemed by quantity, margin and spend.
The second dashboard provided monthly and weekly views of similar KPIs including trend charts at a site level. It also had details on whether the stores were company owned, or dealer owned.
The third dashboard provided key insights into the products being availed and the corresponding customer redemption behaviour. This included a daily view of products across all sites, details of whether the customer purchased fuel while also redeeming their free coffee, day wise trends of spending, an hourly breakup of total spend and count of customers, the breakup of commercial (Business to Business or B2B) and retail (Business to Customer or B2C) customers etc. The different technologies used for this engagement included,
- Microsoft Power BI
- Microsoft SQL
- Azure Databricks
THE IMPACT
With the comprehensive new redemption dashboards, the company’s UK team had complete visibility into the success of their ongoing coffee redemption program. Not only were the able to understand the trends in coffee consumption and redemption behaviour but they now also had more customer insights with the market basket analysis. The best performing stores were also identified and could be earmarked for future programs.
